Global
The global sea level rise faster at present than anytime during the at least last 7,000 years, and the speed seems to still accelerate. NOAA (National Oceanic and Atmospheric Administration in USA) upped their estimate of the sea level rise trend from 3.2 mm/year 2016 to 3.4 mm/year 2017, and their extreme scenario for 2100 from 2.0 m 2012 to 2.5 m 2017. Still, they have excluded several factors they believe will increase the speed further but for which long time models are missing, like faster flow of glaciers to the sea because of the collapse of hindering shelf ices, faster melting of glaciers because of increased absorption of solar radiation in the surface where dark particles have been enriched from earlier melting, and faster global warming because of major release of the powerful greenhouse gas methane from thawing permafrost mainly in Siberia. According to NASA (National Aeronautics and Space Administration in USA), the sea level rise 2011-2016 was 5.8 mm/year, 70% higher than the NOAA trend estimate of 3.4 mm/year. In total, sea levels are estimated to rise another 65 meters if all remaining ice sheets melt.
Consequences
The rising sea level causes both a continuing permanent flooding of lowland areas, mainly along sea coasts, but also more frequent temporary floodings, in combination with tides, strong onshore wind and depressions. This can make large areas uninhabitable long before they have been permanently flodded. This has already happened to several archipelagos in the Pacific Ocean, where formerly inhabited islands have been evacuated. The population density is often higher in lowland areas than at higher altitudes, causing many people to be affected even at moderate sea level rise. According to the World Bank, 5% of the world population lives in areas with an altitude lower than 5 m above present sea level, which means about 2.5% or 200 millions of the Earth's population of 7.5 billion 2017 would be directly affected by a sea level rise of 2.5 m. This would create a refugee disaster 3 times worse than the refugee situation 2016, when there were 65 million refugees throughout the world.
Sweden
In Sweden, about 0.21% or 21,000 of 9,995,000 residents (2016-12-31) would be affected at a sea level rise of just 0.5 m, 0.56% or 56,000 at 1.0 m, 1.03% or 103,000 at 1.5 m, 1.78% or 178,000 at 2.0 m, and 2.74% or 273,000 at 2.5 m. 117 communes or 40% of the 290 communes in Sweden would be directly affected by a sea level rise of 2.5 m.
SeaLevelRise.se
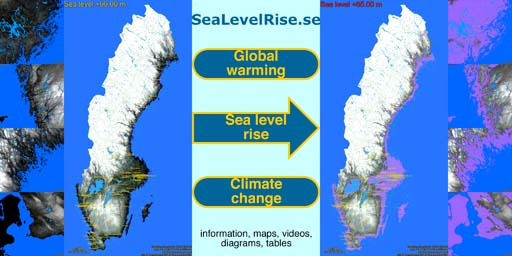
SeaLevelRise.se presents Earth, Sweden and the 194 Swedish communes potentially affected by sea level rise on 327 pages with 6,664 maps, 1552 videos and 428 3D scenes showing flooded areas, and 195 diagrams and 233 tables showing the areas and number of residents affected, per commune and all of Sweden, at various sea level rises up to the extreme 65 m.
SeaLevelRise.se contains the following pages:
- Home: main page with brief introduction and contents.
- Background: information about global sea level rise.
- Estimate: estimates of global sea level rise and speed.
- Earth: 34 maps and 4 videos showing global effects of sea level rise.
- 17 pages with 2 maps and 1 interactive table each, showing consequences of sea level rise for each country.
- Earth - 3D Coasts: 428 interactive 3D scenes and 19 partial indices with previews showing coasts around the world.
- Earth - Coasts 2: links to 370 YouTube videos and 16 partial indices with embedded YouTube videos showing effects along coasts around the world, in high quality.
- Earth - Coasts: links to 370 YouTube videos and 16 partial indices with embedded YouTube videos showing effects along coasts around the world.
- Earth - Refugees: the refugee situation in all countries 2017.
- Sweden: 4 videos, 1 diagram and 1 table showing effects of sea level rise for all of Sweden.
- Sea level rise 0.0 m - 65.0 m: 17 pages with each 2 maps and 1 table showing effects of some sea level rises for all of Sweden and all 290 Swedish communes.
- Communes: indices alphabetically and by population size of 194 communes in Sweden potentially affected by se level rise.
- A - Z: 14 partial indices alphabetically with map previews.
- 0 - 999,999: 14 partial indices by population size with map previews.
- Areas: 194 pages with each 34 maps, 4 videos, 1 diagram and 1 table for individual communes.
- GE: 1 page with 28 Google Earth videos for Stockholm.
- Legend: legend for maps and tables.
- Links: links to external sites with information about sea level rise.
- About: information about the site SeaLevelRise.se.
- Production map: geographical production areas for maps and videos.
- Production plans: 4 plans for production of batches of maps, videos, diagrams, tables and pages.
- Work log: log of activities at and around SeaLevelRise.se.
- Svenska: link to the corresponding page in Swedish.